Learn how to create an infographic for B2B SaaS content marketing.
In today’s visual generation, social media channels like Pinterest and Instagram have exploded onto the scene and captivated our attention as they’re all about visuals, and I love it!
As they say, “a picture is worth a thousand words,” and visual communication is a powerful way to get your point across to the audience.
While the importance of long form content pieces still remains, it’s a fact that the human brain processes visual content faster than text.
Infographics can tell a complex story quickly and help you connect with your audience faster – be it for educational purposes or to sell.
But only when done right.
In this blog, I’m talking all about this untapped B2B content format – infographics for B2B content marketing.
What is an infographic?
An infographic is a visual representation of ideas and data designed to provide the readers with relevant facts that are easy to read, understand and absorb.
Infographics come in various formats, but they all have one primary goal, to convey maximum information in one graphic that is easy to comprehend and remember. They contain visual elements such as graphs, charts, and illustrations, accompanied by minimal text.
Why do infographics work?
There are various content formats that can be used in B2B SaaS marketing. So why do I think this age-old content format can still win?
Here are some reasons why your B2B content marketing strategy needs infographics:
1. Infographics can capture the audience’s attention immediately
When prospective clients land on your site, they want information, and they want it quickly. The process of hunting for the best service provider or supplier can be a tedious task for a customer. They may not want to spend too much time reading every word of an article.
Instead, if your website has eye-catchy graphics, well-arranged text, colorful imagery, and concise data in the form of an infographic, it’ll work wonders for your business. The good thing is that it can serve as a summary to your long-form content for those with a shorter attention span!
2. Infographics can open the door to curiosity
A successful infographic can be a highly effective tool for a robust content marketing strategy. Content creators can make or break a piece of written content with the headline.
A great headline can spark curiosity and set the hook, and this is precisely what an excellent infographic can do when the audience comes across one.
When the reader comes across an appealing and engaging synopsis of information summarized into one attractive graphic, it interests them in learning more. The graphic acts as an invite, and your curiosity piques as the invite looks and sounds interesting.
3. Infographics establish brand awareness
One primary objective of a good content marketing strategy is to boost brand awareness. If the content on your website is informative and shareable, it is bound to get social media attention and further boost brand awareness.
An strategically done infographic is an excellent technique to convey your brand message. When implemented accurately, these visual representations of your B2B business can become invaluable to a versatile marketing effort.
As per a study, 65% of B2B marketers use infographics for content marketing purposes, making it one of the top five most used types of content.
Apart from being attention-grabbing, infographics provide concise information and visual content, gaining popularity as a format for digital content marketing.
What are the different types of infographics for B2B content marketing?
There are several ways to use infographics to educate your target audience.
Let’s look at 9 different types of infographics that can be used in B2B content marketing:
1. Informational Infographics
Informational infographics are used to describe a broad overview of a subject and explain concepts.
They are the best way to visualize a specific concept and are typically divided into sections, each comprising a subheading, illustrations, and text to convey the information.
Various techniques, like swapping the colors and directions, can make the infographic more engaging.

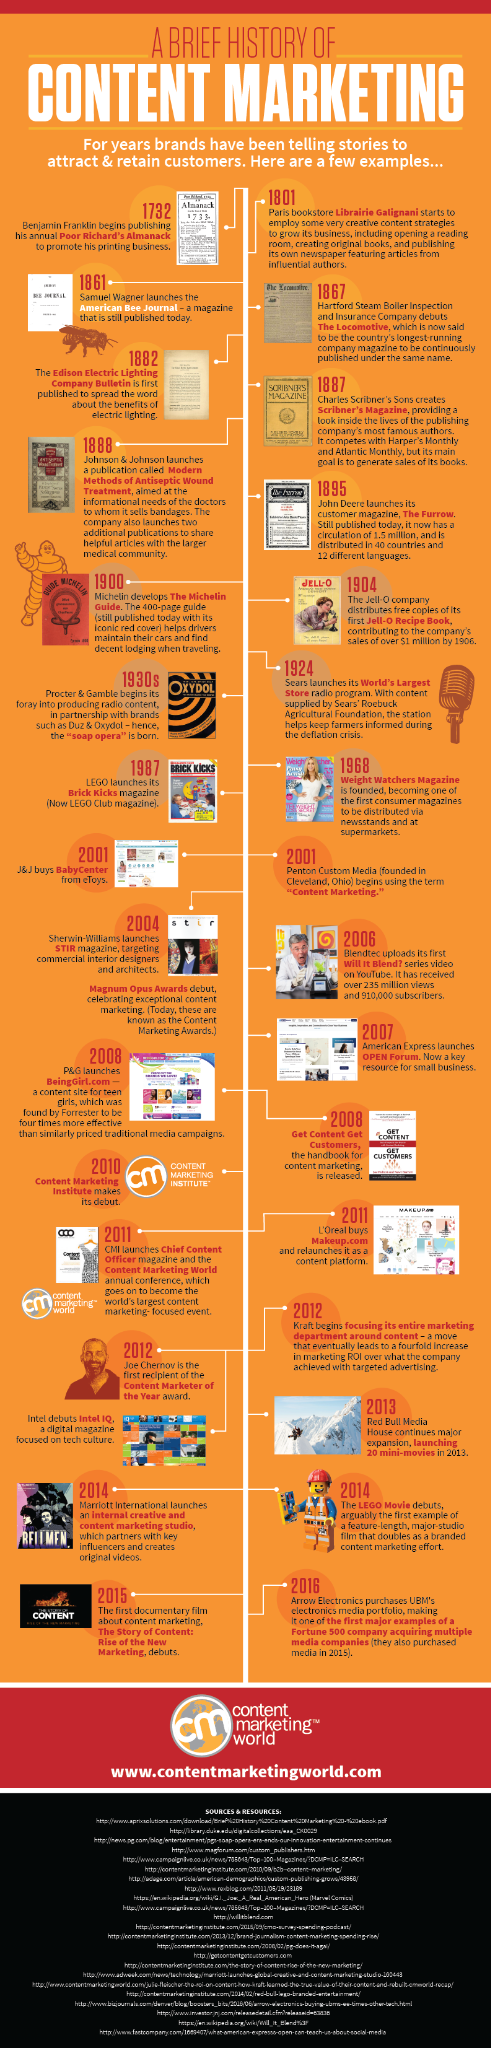
2. Timeline Infographics
Timeline infographics are typically used to tell a story in a linear or chronological manner which helps envision the history of something by highlighting essential dates or an outline of events.
Visual timeline infographics help create a clear picture of the timeframe using components such as labels, text, icons, and images to highlight and explain the points in time.
Take a look at this example of a timeline infographic. Would it be easy to read and retain so much data if it were written as an article? Probably not. But, with a timeline format, you can quickly and efficiently process and digest this information.
3. Statistical Infographics
Numbers make for authoritative marketing tools; you can present numbers without intimidating the audience through statistical infographics.
Statistical infographics are used to display survey results along with effortlessly sharing vital information. The statistical infographic focuses on the data, while the layout and visuals tell the story related to the data.
Statistical infographics are an excellent way to showcase the data by engagingly presenting them. They are used to share survey data, present research findings, or back your arguments with some vital statistics by using graphs and charts to deliver a compelling story with numbers.

4. Process Infographics
If you want to take your audience through the various steps or procedures in a process, it’s best to use a process infographic to communicate that information.
A process infographic streamlines and describes the steps of a process in visual terms. It demonstrates what happens in each step with an appealing layout that is easy for the reader to understand and follow.
You can use features such as arrows and lines to make the process infographic easier to grasp. You can also use color-coding and number the processes to help the readers.
Here’s an example of a process infographic of a creative design process:

5. Map Infographics
A map infographic is a visual representation of location-based information which provides geographic data, demographics about your audience, location-based statistics or industry data and travel or tour recommendations.
The data should tell a story to your audience as long as they find it valuable and the data relates to your brand. The blend of geographic illustrations and text descriptions in a map infographic works together to create magic.
Take a look at this map infographic which compares gas prices around the world:

6. Comparison Infographics
A comparison infographic is the best way to present the information when you want to compare services, products or pricing packages.
These kinds of infographics make comparisons using illustrations which helps people make informed decisions. You will have to make a list of every feature and its uses by using icons or illustrations to present the information visually.
Here’s an example of a comparison infographic by iPhone that quickly compares their phones to help the buyer understand the difference between the two and decide:

7. List Infographics
List infographics are excellent for listing, summarizing, or highlighting points. This type of infographic can be used to share quick tips or recapitulate long blog posts by highlighting the article’s essential details.
Make your list easy to remember for your audience by keeping your list on point, using borders or boxes to group the features together, and using icons to make important points stand out.

8. Interactive Infographics
An interactive infographic is a combination of traditional design, motion, and interactive elements. This kind of infographic is frequently used in data visualization for complex ideas and gamification content.
Interactive content receives twice the amount of engagement than static content, encouraging users to participate and helping them discover information independently. They can view the infographic based on the options they choose.
Here’s an interesting interactive infographic:

9. Flowchart Infographics
A flowchart infographic shows a structure of involved steps in a process or actions, using images, layout, and text to make communicating your goals clear and compelling.
The flowchart infographic demonstrates simple workflows, presents solutions, shares possible scenarios or consequences, and concisely describes processes with multiple paths.
Flowchart infographics boost engagement and give a clear idea of the process and its workings. It does not delve too much into technical details; hence, even a layperson can follow the process.
Here is a flowchart infographic example showing a detailed customer journey map description.

How to create a good B2B content infographic?
With so many types of infographics, you are sure to be spoiled for choice.
However, regardless of the format you choose, you must be able to achieve your visual storytelling goals with little to no confusion in presenting data on a relevant subject.
Whether you want to show complex data, marketing campaigns, or global statistics, always start with an end goal in mind.
Here are some steps I recommend following:
- Define your target audience – Not all your audience segments are looking to learn from infographics; ensure you know who you’re creating them for as this can impact the depth of content you offer, the colors and other visual elements you use.
- Set a clear goal – Creating infographics takes time and effort from both the content and design teams, so ensure that you know what business goal or objective they will serve; for example, is it to improve image SEO or to get more shares?
- Tap into untapped topics – Take a look at the infographics available around topics relevant to your business; identify those that have been defined with complex visuals or have a gaping hole of opportunity to take on.
- Create a content calendar – Similar to how you create a content calendar for blogs, web pages, ebooks and more, create one for your infographics. This helps you visualize what purpose the infographic fuels alongside the other content you’re creating.
- Streamline your content – Don’t try to drag an infographic into pages; if the topic is too vast, break it up into smaller infographics instead.
- Design for ease of reading – Much similar to the readability score on blogs, infographics need to be easily read too. From the smallest of aspects such as the number of sections or the length of the infographic to fonts, font size, font color and more, ensure it presents information in the best way forward.
- Publish and optimize – When you publish an infographic, ensure you’re not skipping on image SEO. Write a quick 500 word blurb to go along with it and ensure your ALT text has the right keywords.
- Promote it – Just like your other content formats, remember that you will need to promote your infographics. The more noticed it is, the more likely it becomes for your target audience to share it (and maybe even link back to you for it).
- Measure and optimize – See how your infographics perform in terms of image SEO, shares, saves and the backlinks it generates. Take note of topics that tend to do well and double down on the strategy that works best to optimize your next set of infographics!
Wrapping Up
In today’s competitive B2B marketing world, the best way to stand out and differentiate yourself from the crowd is by creating content that engages your audience and grasps their attention.
And infographics are one such type of content that comes to your rescue.
Think beyond the wordy articles and use infographics in your landing pages, blog posts, email newsletters, social media posts, and case studies.
Having engaging and appealing infographics will help create awareness, attract traffic, and generate quality leads – and also get you brownie points from image search engines.
Want to spruce up your content marketing strategy in innovative ways?